
Why We Did This Study
Students who receive special education services tend to perform below their peers on state achievement tests (for example, the Massachusetts Comprehensive Assessment System, or MCAS). Different factors may influence how well students in special education do on these tests relative to their general education peers, like how many students in a district are economically disadvantaged, how much money the school spends on special education, and the total number of special education students in a district. Another factor that might play a big role, but has not yet been researched, is the geographic location of a school district. If we have a better understanding of how the geographic location of a school district influences special education students’ achievement relative to general education students, this might help district leaders make decisions about how they distribute special education services.
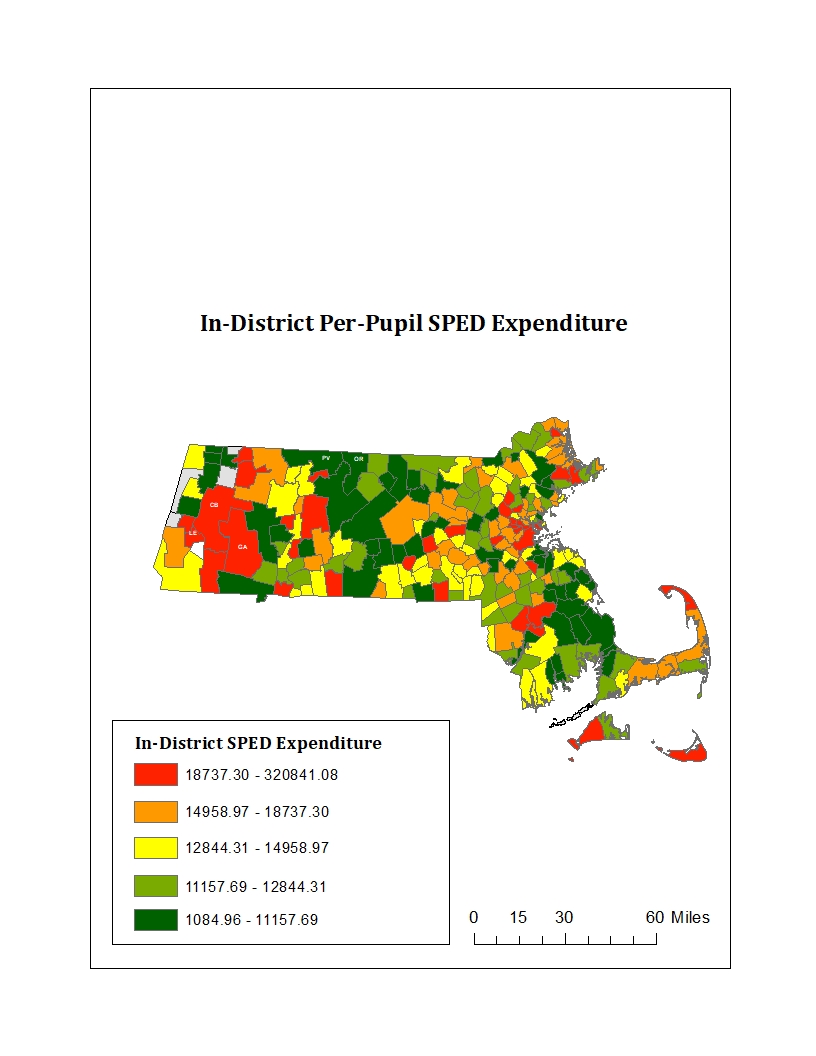
What We Are Doing
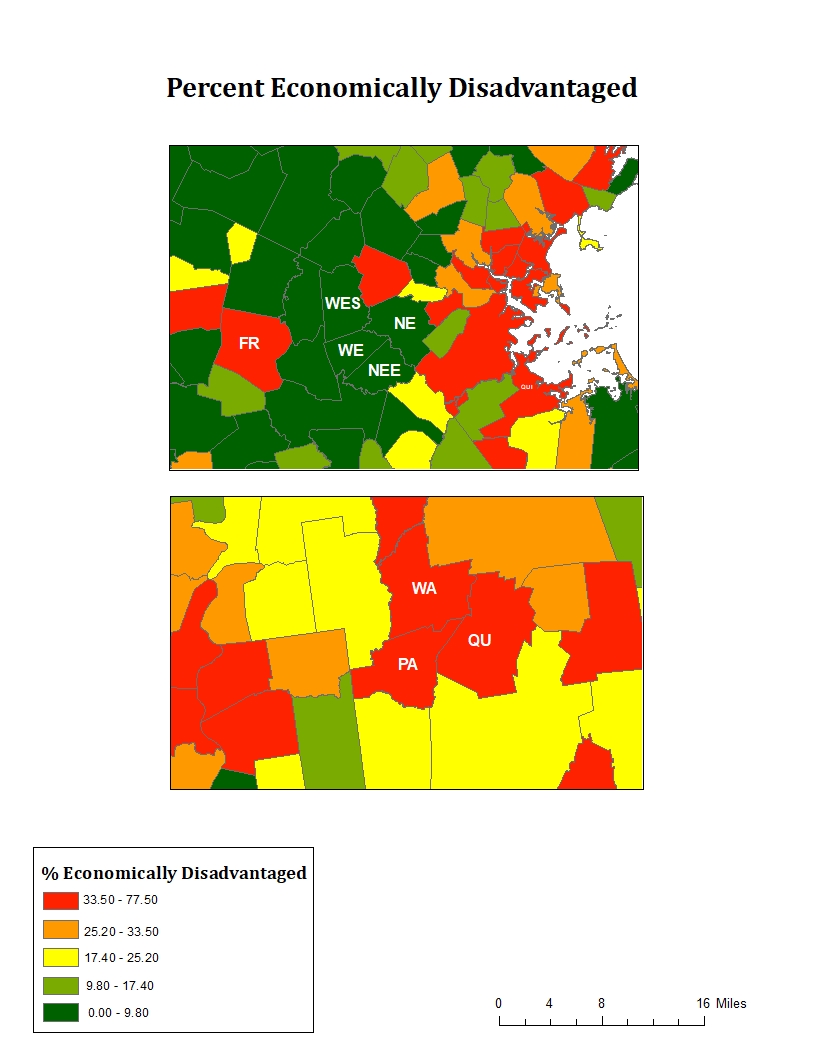
We used the Massachusetts Department of Elementary and Secondary Education website to gather information on each public school district within Massachusetts. First, we used a traditional statistical technique (regression) to show how each factor described above (the number of economically disadvantaged students in a district, how much money the district spends on special education, the total number of special education students who take the ELA MCAS and the Math MCAS) influences how well students in special education perform on MCAS tests relative to their general education peers. We used this same information to make six detailed maps using ArcGIS software. Each map outlines the geographic regions that belong to the public school districts within the state. In addition, there are five colors (dark green to dark red) that map onto the school districts. These colors differ depending on how the district performs on each factor.
What We Found Out
Traditional statistical techniques, such as regression, make it possible to reveal overall trends in the data. For instance, school districts that educate a higher percentage of economically disadvantaged students also show larger differences between special education students and general education students on tests of academic performance. The maps that were made allowed us to locate these geographic trends and also identify individual school districts that defy the results of the regression. For example, districts such as Quincy and Framingham have a high percentage of economically disadvantaged students but their special education students perform similar to their general education students. This is a result that is unexpected, and would not be possible to detect with traditional statistical techniques.
What This Means
Geospatial maps provide an opportunity to focus on specific regions in the state that go against the regression results and could benefit from more in-depth research. Further examination of specific districts that go against the trend and other districts in close proximity could help researchers to understand how the sharing of resources, information, and social connections impact student academic performance.